Unofficial guide to MTDBG
Disclaimer
This is an unofficial guide, targetted at the beginner. The official documentation is called 'mtdbg.txt' and can be found in DOCPACK program in KolibriOS.
What is MTDBG ?
MTDBG is the application-level debugger for KolibriOS.
It can make your life easier on many occasions. Whether you are still learning assembly and just want to see what's going on, or you are trying to fix that bug that nobody else has the guts for.
Loading your application
There are several ways to load your application into the debugger.
You could simply click 'MTDBG' icon on the KolibriOS desktop and use the 'load' command from there.
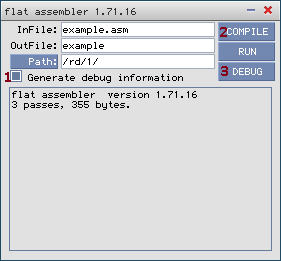
Another option is to load it from FASM (in KolibriOS) with 'debug' button.
The third option is to load directly from tinypad by pressing f10 or choosing "run > run in debugger" from the menu while your source code is opened in tinypad.
Loading symbols
The debugger works with binary code. It views the unassembled code to the developer, but this code has much less information then the original assembly code.
All information such as labels, comments etc. were lost during assembly process.
When working on a binary, this information cannot be recovered.
When you have the original source code however, it can be useful to load this information into the debugger so it displays the original label names additional to the hexadecimal addresses.
In FASM on KolibriOS, select the 'generate debug information' check-box before assembling your code.
FASM will now create a *.dbg file in the same folder as the binary, which should be automatically loaded by MTDBG when loading the binary.
Using breakpoints
Single stepping can be really fun when you have nothing else to do, but most developers probably want to spend their time usefully.
Therefore, you can request the debugger to halt the execution of the program when a given instruction is about to be run.
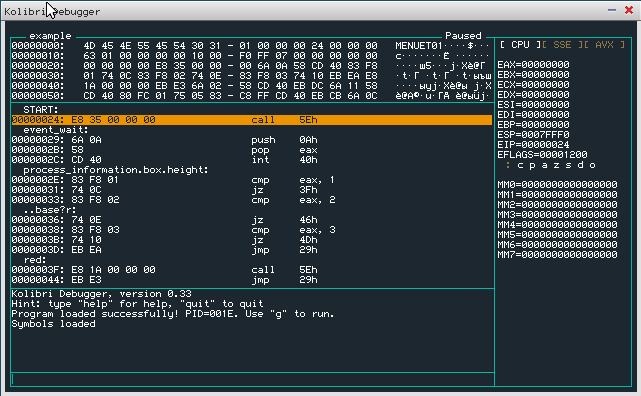
Lets assume we have our symbols loaded, and we are interested in what happens after the label 'red'.
(Offcourse you can also enter addresses in hexadecimal, when no symbols are loaded, or the instruction of interest has no label)
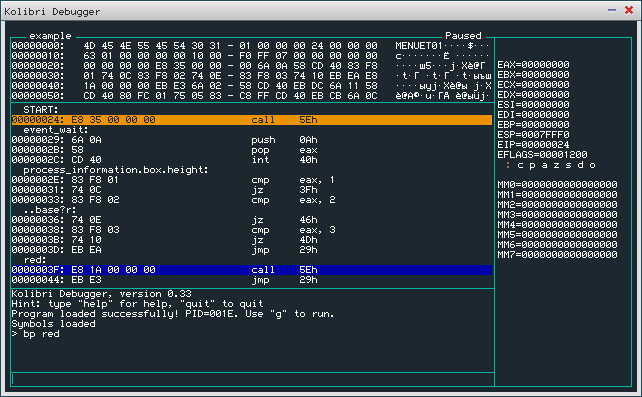
While the program is suspended (default state after loading a program), type 'bp red' to set the breakpoint.
You will see the label highlighted in blue in the disassembly view.
Now you can run the program (eg by using the command 'g') and the program will suspend when the subroutine of interest is reached.
Commands
loading files into the debugger
load
Load the program you want to debug.
eg. 'load /rd/1/example'
load-symbols
Load the debug symbols.
These symbols can be generated with FASM on KolibriOS by selecting the 'generate debug symbols' option before compiling the code.
The debug symbols have .dbg extension.
If the symbols exist in the same directory, and with the same filename as the binary, they will be loaded automatically.
eg. 'load-symbols /rd/1/example.dbg
controlling the view
d
Dump data at a given addres.
Parameter can be direct hex address, register or label.
eg. 'd esi'
u
Unassemble code at a given addres.
Parameter can be direct hex address, register or label.
eg. 'u redraw'
Stepping and running
s
Single step. Execute the following instruction and then halt.
g
Go on. (Resume execution of program)
Execution will terminate when a breakpoint is reached, the application exits or when there occurs a fault (divide by 0, page fault, ..)
reading/manipulating the registers
?
Calculate the value of an expression (and print the value to the debugger).
eg. '? eax - ebx'
r
Change the value of a register to a given expression.
eg. 'r eax 1234'
eg. 'r eax edx'
breakpoints
bp
Set a (regular) breakpoint.
The debugger will suspend the debugged process whenever such a point is reached.
eg. 'bp redraw'
eg. 'bp 1234'
bpm
Set a data breakpoint.
The debugger will suspend the debugged process when the data at the given address is being accessed.
You must give the size of the data type (b = byte, w = word, d = dword) and the type of access on which you want to break (r = read/write [default], w = write only)
eg. 'bpm w 1234'
bc
Clear a breakpoint (remove it completely).
eg. 'bc 0'
bd
Disable a breakpoint (but remember the address in list).
eg. 'bd 1'
be
Enable a previously disabled breakpoint.
eg. 'be 0'
bl
List all active breakpoints.
Expressions
Some of the previously listed commands accept so called expressions as an input.
Expressions can include:
- Hexadecimal constants.
- Names of general-purpose registers.
- +, -, *, / arithmetic symbols (with standard priorities) and brackets.
- labels from symbol file.
some examples:
eax
eip+2
ecx-esi-1F
al+ah*bl
ax+2*bh*(eip+ a73)
*esi*di/eax


